Housing, Income, and the Progressivity of Taxing Property
by Mason Gaffney
Many pundits and economists tell us we should abate the property tax because it is “regressive”. Their case has several parts, which I have dissected and refuted elsewhere (see www.masongaffney.org –> “The Property Tax is a Progressive Tax”). One method is to pretend the property tax falls just on homeowners, assuming away all the corporate, and other industrial, commercial, rental, recreational, mineral, utility, and speculative property, which constitute more than half the base. Then the pundits paint the homeowner as an average Joe or Jane, a struggling little guy or widow, in debt, overtaxed, needing all our sympathy and support. To spare these poor we must spare the rich in their mansions with wide grounds. To do so we tax instead sales, incomes, payrolls, utility customers, and business activity. We are also to starve the schools, hospitals, parks, mass transit, and other public services, a view that the Howard Jarvis Taxpayers’ Association, now led by Jon Coupal, earnestly champions.
Our focus here is on homeownership. Many basic economics texts tell us that shelter costs are over half the budgets of the very poor, and as we step up to higher income brackets, shelter costs rise by smaller steps. In economese, they write that “the income-elasticity of demand for housing is less than one” – in English that means that if income rises by x%, housing outlays rise by less than x%. Goods like that are labeled and classed as “necessities” as opposed to “luxuries”.
Ernst Engel, a Prussian official and statistician, long ago observed this rule for food (“Engel’s Law”) by studying real data on household budgets. Many later writers have simply assumed this Law also applies to shelter, that being another “necessity”. Charles E. McLure, Jr., for example, in a work edited by Richard Musgrave, calls the property tax on housing “highly regressive”, with no need for proof. Most such allegations are a priori, unsupported by observation, except sometimes by cherry-picked examples that run against the major trend of the data, which we really should look at in the whole, as we do later in this paper. The municipal government of the District of Columbia has issued several reports, over the years, alleging that higher-income people spend a lesser share of their incomes on housing. One of them, by Daniel Lucas, was actually based on HYPOTHETICAL housing data. Yet economists all over the country cited it for support, an astounding travesty of scientific method.
Liberal reformers who would repeal Prop. 13 and its clones in other states have accepted this belief, at least politically, and proposed a kind of 2-rate property tax that applies a low rate to homes and a higher rate to “business”. Robert McIntyre of Citizens for Tax Justice, a union lobby, has long pushed this view. Leo McCarthy launched it in California years ago; Rob Reiner and Lenny Goldberg tried again in 2006, in vain. Skeptics have asked what’s the point of attracting more residents while driving away jobs.
This idea that all or most consumer spending rises slower than incomes has a long history, over-generalizing from Engel’s Law. It was a centerpiece of Keynes’ early analysis, taught as gospel to every student of economics after 1946, labeled pretentiously as “the consumption function”. This “function” is a line on a graph showing consumption, measured on the vertical, related to income, measured on the horizontal. It slopes upwards to the right as income rises, but at less than 45 degrees, becoming an ever smaller fraction of income.
A problem with the function is that consumption cannot start from zero, even when income is zero or negative. People must consume something to survive. It turns out that when you rank people by income, those in the lowest bracket consume about twice as much as their incomes. How can people do that, year after year? They can’t and they don’t, for many reasons other than charity and welfare. For example:-
- Many have highly variable incomes over life: medical students training to be brain surgeons; actors; athletes; hedge-fund managers (“shooting stars”); building contractors; etc. When you catch them in a bad year, they are consuming from past good years, or expected good future years
- Many retired people live on savings
- Many people borrow on their equity in appreciated lands, and consume the proceeds. Appreciation is not counted with current income (it should be, but isn’t)
- Some trust-fund babies consume lavishly for years without working
- Middle-aged people may squander savings today, expecting to inherit tomorrow
- Some live in the old family home, whose imputed income is not included in measured income, letting them spend more on measured and recorded “consumption”
- Probably most weighty, many high-income people are clever at concealing their taxable income, and economists, who should know better, take their income data from the IRS and pretend the data are valid. Garbage-in Garbage-out, anyone?
To ignore such matters can make almost any tax or charge on consumption look “regressive”, because consumption exceeds income in the lowest bracket. As measured incomes rise, consumption necessarily rises slower, from that high starting point. Good statistics books warn against the error, calling it part of “regression fallacy”. Most economists and other analysts go right on spreading the fallacy, however, with respect to housing.
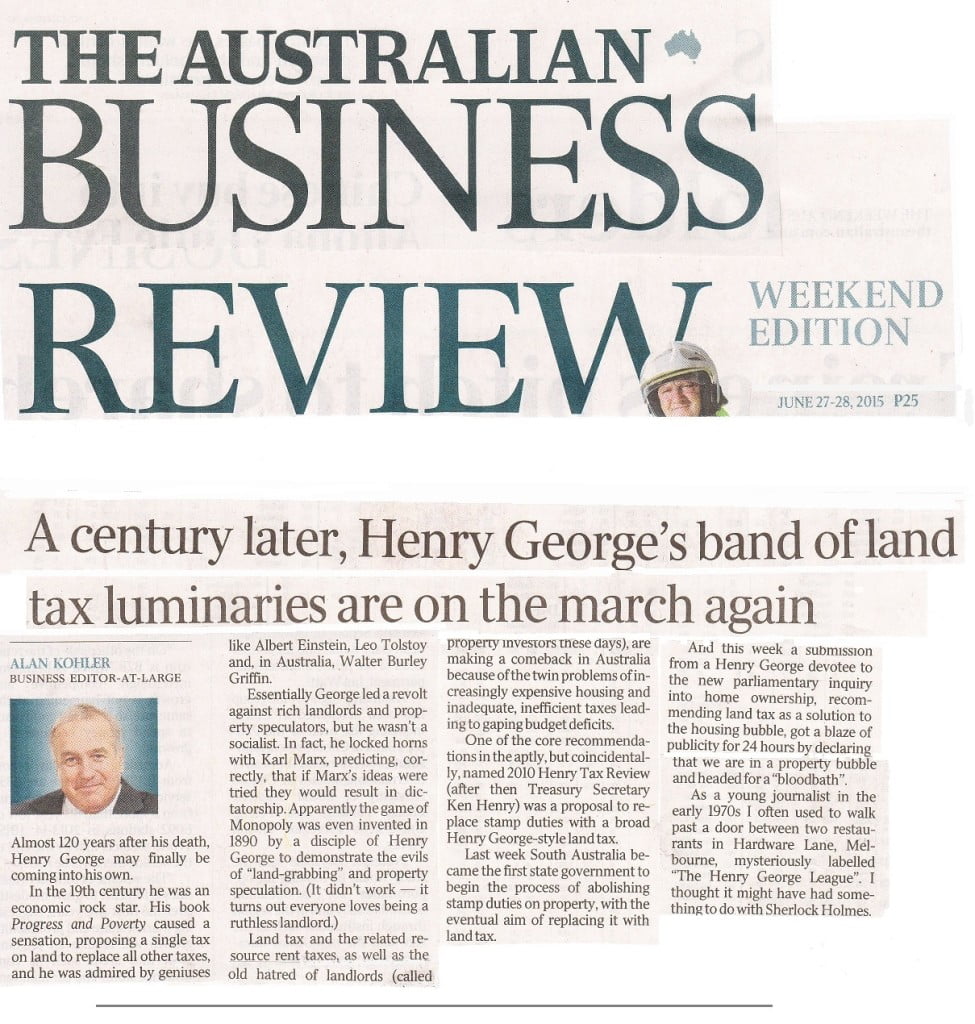
Henry George, without benefit of a statistics course but using his eyes and common sense, saw through the fallacy. “(I know) a man … who used to boil his own beans, … (but now) has got rich, maintains a town house that takes up a whole block, … two or three country houses with extensive grounds, a large stud of racers, a breeding farm, private track, etc.” (Progress and Poverty, pp. 247-49). Higher incomes raise demand for land faster than incomes rise. Land for shelter and recreation is a luxury. It is also, of course, a good hedge against inflation, an investment, a long-term speculation, and a short-term one in most years (but not in all years – witness 2007!).
Later, when touring the British Isles, George saw nobles keeping vast country estates in those “overcrowded” isles. To get a little more hunting and fishing and riding space they evicted whole villages of people, who could go press on the means of subsistence elsewhere. Today we see the same process in the U.S.A., lacking the nobility but having the essentials: money and power.
Chicago School economists, to their credit, saw through the “regression fallacy” in Keynes’ “consumption function”. They were most sensitive to the life-cycle bias. To get away from it, they saw that you don’t need to follow individuals over their whole lives. Rather, in most towns you have people in all stages of the life cycle, so just compare figures on income and consumption between one town and another. It’s called “cross-sectional” as opposed to “time-series” analysis. The towns are called “instrumental variables”. One Chicago economist, Margaret Reid, did this specifically for housing, and found that housing is a luxury good.
We can do it too, right here and now. As we go from poor to rich areas (be they states, counties, cities, or neighborhoods) incomes rise, but home values rise faster. Here are some examples.
- Rancho Santa Fe, in San Diego County, has the highest p.c. income in the U.S., yet the ratio of housing values to p.c. incomes there is 10/1, compared with about 2.5/1 or 3/1 for the whole U.S. (in the boom-bust cycle the ratio changes from year to year)
- In Beverly Hills, the ratio is 11/1; and so it goes for several other famously rich cities like Coronado, Malibu, Santa Monica, Greenwich, Sag Harbor, Woodstock (VT), Nantucket, etc.
- In Honolulu the ratio is 5.5, compared with 1.7 in Wichita, Peoria, Buffalo, Rochester, and many other low-income cities
In addition, housing density falls as incomes rise: the U.S. Census reports that half the homes larger than 3,000 square feet are occupied by couples living alone, a meager 2 persons per house. In Indian Wells, CA, wealthiest in Riverside County, there are fewer than one person per house, compared with 5 or more in Home Gardens, a poor civil division jammed between Riverside and Corona. In Santa Ana, another refuge for the poor, there are 5 legal persons per home, and many, many more illegally. In several classy places like Belvedere and Beverly Hills the average is two persons per home. Actor Nick Nolte, a prosperous single gentleman, occupies 6 acres in Malibu. Brad Pitt has a compound of houses atop one of the Beverly Hills.
John Talbott in 2003 published data on income and home values for some 123 U.S. cities. If we rank them by income the top 10 have a home/income ratio of 3.7; the bottom 10 of 2.5. Ranking by income is stacking the cards against showing the main trend. We can stack the cards the other way, too, ranking the data by home value. Then the top 10 cities have a ratio of 4.9; the bottom 10 of 1.9. Either way, though, the trend is clear: housing values rise faster than incomes. We could massage the numbers in myriad other ways, as econometricians love to do ad tedium, but not change the basic finding.
Comparing California with the U.S., incomes are a little higher and home values much higher. National and state associations of realtors publish regular “Affordability Indexes” by region, comparing home values with the incomes of potential buyers; California, Hawaii, and other areas of high incomes always rank hear the bottom in affordability, meaning the higher incomes are not enough to make up for the higher home prices. In 2004, a boom year, the ratio of home prices to median annual income was 3.4 for the U.S.A., and 6.4 for California.
Comparing state to state across a wide nation raises questions about other variables, so let’s compare counties in one state. The Affordability Index (percentage of households able to afford the median price) in Riverside County, California, is 56%, compared with 35% in neighboring Orange County, although Orange County has much higher incomes (1999 data). Riverside County has the “cheap dirt”, as the locals put it – although it is not so cheap compared with Oklahoma or Kansas.
Comparing old central cities with suburbs yields consistent findings. A 1990 study of Philadelphia and its suburbs found the ratio of home value to income was 1.6 in the City, and 2.8 in the Pennsylvania suburbs. In Milwaukee the ratio is 1.4, while in abutting Ozaukee County, its highest-income suburb, the ratio is 2.2.
Next, let’s compare cities inside one county, starting with Orange County, CA. Going from blighted Santa Ana through middle class Costa Mesa to upscale Newport Beach, income per household rises by 42%, from $55k to $78k, while house values rise by 222%, from 1.8 times the U.S. average to 5.8 times. In Cook County, IL, the Chicago ratio is about 2.5/1, but in its suburb Kenilworth, also in Cook County, the median income in 2004 was $200k, and the median home sale price was $1.3 millions, a ratio of 6.5/1.
Oakland, CA, and its neighboring upscale enclave of Piedmont are both in Alameda County. From Oakland to Piedmont, median home values rise from $240k to $615k, or 2.6 times as much, while incomes rise a lot less. Note two factors that make Piedmont home values even higher than those numbers show. First, the MEAN Piedmont value is higher than the MEDIAN, because values are highly skewed, even though the population is small. The highest selling price in Piedmont in 2002 was $2.5 million, or 4 times the median, while in Oakland the highest sales price was just 1.5 times the median, even though the population is much bigger. Second, most dwellings in Piedmont house many fewer people than most dwellings in Oakland.
A third factor, not even mentioned yet, is that well-housed people in places like Piedmont also own second, and often multiple homes and recreational lands elsewhere. We do not include the income properties (office, retail, industrial, farm, residential, mineral, warehousing, etc.) they own and whose rents help them afford Piedmont, for here we focus just on real estate they use personally. Who but they own the duck blinds, shoreline cottages with docks, horse farms, game preserves, airstrips, hunting and fishing resorts, hobby farms with vineyards and groves and ranchos, country-club memberships, pieds-à-terre in glamorous cities and cultural centers like Lenox, MA, mountain retreats, ski lodges, dachas, villas, manors, polo fields, and other such rural and lacustrine playgrounds of the rich? The Assessor of Pitkin County (Aspen), Colorado, sends most of his tax bills out of state. Vilas County, Wisconsin (Eagle River, lakes) and Walworth County (Lake Geneva) have the highest land values per resident in the State, mostly owned by outsiders like, for example, residents of Kenilworth, mentioned earlier, who may also own stables in horsey Barrington in the vast playgrounds northwest of Chicago. In Newport Beach, CA, 11% of the houses are vacant at any one time, and not from poverty or lack of demand: the owners are elsewhere.
Finally, the richer places have much higher land/building ratios. In Beverly Hills it’s about 3/1, while in a desperately poor place like the colonias and labor camps of the sweltering inland valleys the bare land has hardly any value which the shacks and trailers, miserable as they are, easily outvalue. The writer has published data (“The Taxable Capacity of Land”, in www.masongaffney.org) from the Lower Mainland region of British Columbia showing the land fraction of real estate value varying from a high of 80% in the posh University Endowment Lands of Point Grey (now being snapped up by Hong Kong billionaires) down to 35% or so in some outlying rural districts. Later data reveal land fractions below 10% in more remote inland towns like little Pouce Coupe, (the Canadian Podunk), Revelstoke, and Dawson Creek. (Both data sets are from the B.C. Assessment Authority, one of the best assessing agencies in North America.)
Putting it together, a property tax based on the value of land in residential and recreational land alone would be progressive. We should impose it for reasons of equity as well as the well-known reasons of efficiency – making it part, of course, of a tax on lands however used.