TO PARAPHRASE FROM MY “UNLOCKING THE RICHES OF OZ – A CASE STUDY OF THE SOCIAL AND ECONOMIC COSTS OF REAL ESTATE BUBBLES 1972 TO 2006”
Question: How much GDP did Australia lose in 2005-6 as a consequence of the bursting of the last three property bubbles, and the ensuing interruptions to economic growth?
It’s realistic to believe that bubbles in land prices can be eliminated by ‘land taxes’ that rather behave like land rents – that is, they cannot be passed on in prices like taxes. If Australia had cut taxes by 50% since 1972 and captured concomitantly a greater amount of land rent, what would be the effect on GDP growth?
The public capture of half the rental value of land would discourage the holding of land for speculative purposes and allow taxes to be significantly reduced on labour and capital.
This is obviously conducive to sustainable economic growth. It’s conservative to assume that the rate of growth achieved through such a pro-growth policy would be at least comparable to the maximum growth rate achieved under current counterproductive taxation policies.
It should be noted that elimination of real estate bubbles implies elimination of cycles of boom and bust, and therefore of the retrogression in growth that takes place within each ‘business cycle’.
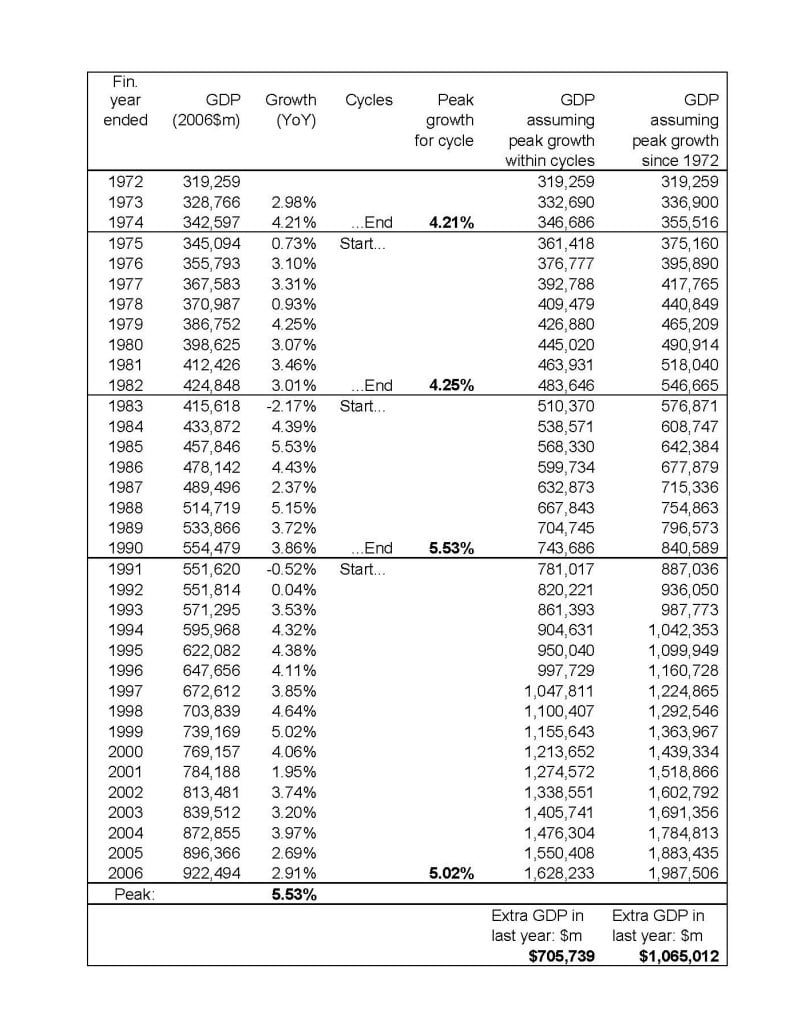
Therefore, if we start with Australian GDP for the financial year ending 1972, expressed in 2006 prices, and assume that the highest real year-on-year GDP growth figure achieved since then had applied in every year, GDP for the 2006 financial year would have been a staggering $1.98 trillion, that is, more than $1 trillion higher than it actually reached – as shown in the spreadsheet below.
It could be alleged that this approach is optimistic in that it fails to allow for possible long-term variations in growth potential, and that it would therefore be better to raise the hypothetical growth rate for each cycle to the highest actual growth rate recorded within that cycle – ie. not the highest for the whole period under study. Accepting this reasoning, if the cycles are taken as beginning in the recession years, namely the financial years ended 1975, 1983 and 1991, and the highest year-on-year growth figure for each cycle (or part thereof) is applied to every year of the cycle, GDP in the financial year ended 2006 would nevertheless still have been a remarkable $700 billion greater, as also shown in the spreadsheet.
Even on the more conservative calculation, the GDP lost due to current misguided tax policy amounts to $35,000 per year for every man, woman and child in the country, a figure that should give pause to all Australian policymakers and politicians.
NOTE: THE ABOVE ANALYSIS WAS CONDUCTED BACK IN 2006, SO THE 2015/2016 FIGURE WOULD BE MUCH GREATER NOW, WITH THE BURSTING OF THE FOURTH BUBBLE LOOMING OVER US. THEREFORE THE QUESTION MUST BE ASKED:
“ARE MESSRS TURNBULL AND MORRISON UP TO GIVING ANY THOUGHT AT ALL TO THESE CONSIDERATIONS IN THE CURRENT TAX REFORM/TAX ABOLITION DEBATE?”
I DOUBT IT: SO, NO UNIVERSAL BASIC INCOME FOR YOU, FOLKS. YOU’D BETTER PREPARE FOR AUSTRALIA’S VERY OWN VERSION OF “AUSTERITY”! (OUR “TAX REFORM” WILL PROBABLY INCORPORATE AN INCREASED GST!)